A web-application to interactively visualize badminton exercises in 3d.
uses for the creation of the visualization.
The entire project is based on -objects.
Therefore, you can save and load states of the web-application.
You can also write your own presets directly in if you prefer that over the user interface.
For details to the different available options I recommend you have a look at the Schema.json file (available from within the UI).
Have a look at Figure 2 for a visualization example.
An acknowledgement if you find the application useful is appreciated.
Example plot for a visualization.
The shown exercise (Feeding Butterfly) shows the player on the $y > 7.5$ side.
The feeder is positioned on the opposite end.
A plotting framework to visualize 2.5 dimensional data (set of dataseries where each series is linked to one additional unique value) in 2 dimensions.
I originally developed to solve the , but realized that the method is general enough to potentially be useful in other fields as well.
Have a look at Figure 1.
Example plot for an plot.
The displayed object is a simulated from .
Different colors denote different passbands.
The $\theta$-axis (angular) shows the passband wavelength.
On the $y$-axis (angular, individual panels i.e., fraction of the entire semicircle plots the brightness in ).
Finally, in radial direction ($x$-axis) I show time relative to the first recorded datapoint.
For the plot referenced in have at look at this archived visualization.
add-on to bring into 3d-space.
Allows generating random networks, loading of networks from supported simulators, loading custom designed networks.
For more information checkout the repo and Documentation.
An example-network generated with is shown below.
Example for an animation generated with .
The displayed network is directly imported from a simulation.
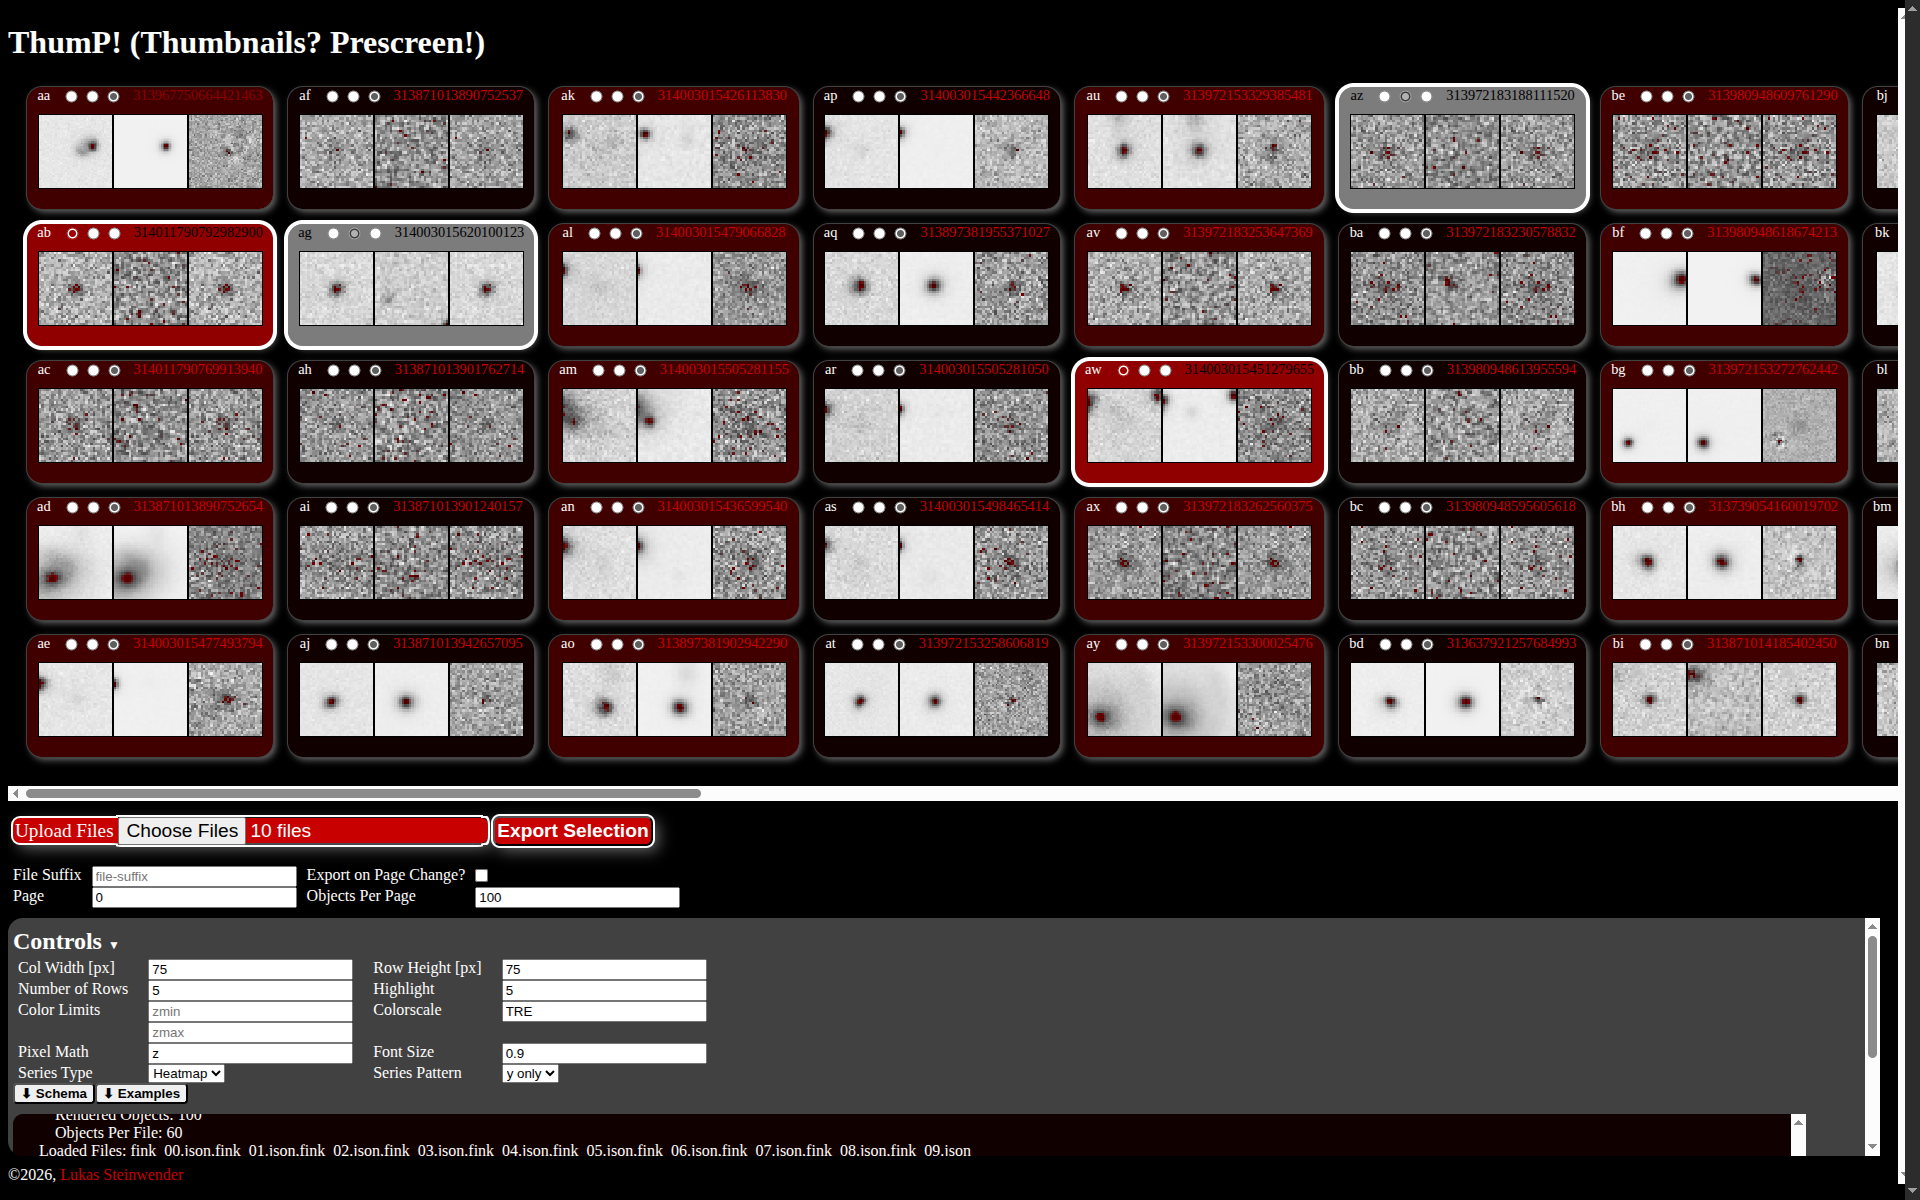
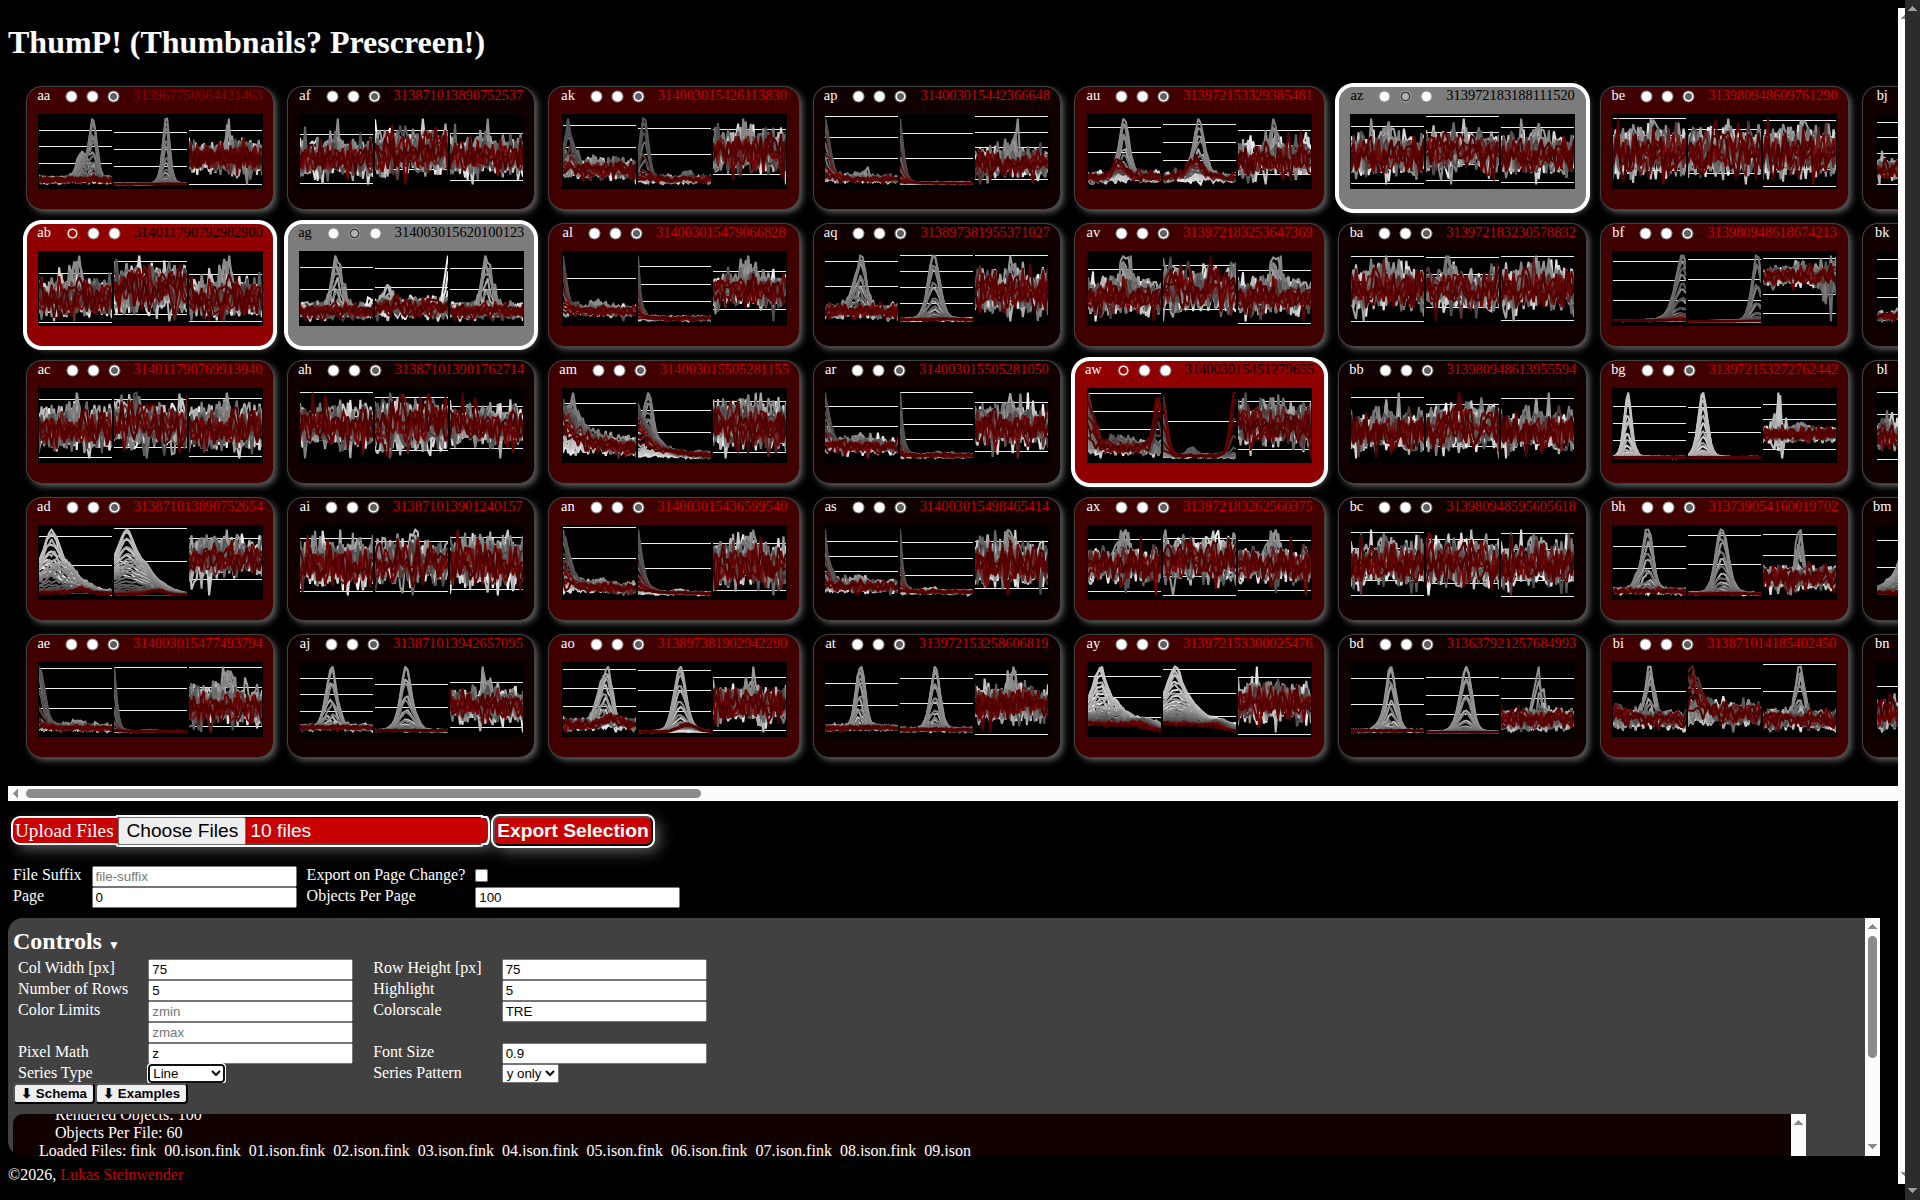
Web application to facilitate visualization and prescreening of a large amount of images (mostly thumbnails).
The original intended use is to quickly select interesting objects from difference images of large astrophysical surveys such as .
The name is inspired by a few words:
"Thumb" for thumbnail.
"Dump" referring to dumping a bunch of data in one place.
And finally "thump" (onomatopoetic), the dull sound it makes when you hit your thumb with a hammer, because we all experienced a similar feeling when trying to sift through a large amount of data.
Have a look at Figure 3 for visualization examples.
An acknowledgement if you find the application useful is appreciated.
Example screenshots of a .
The left shows the initially intended application for screening thumbnails.
On the right I show a variation where lines are visualized for each row in the corresponding thumbnail.